


By clicking the 'Subscribe' button, you agree to our Terms & Conditions.
Data Stories
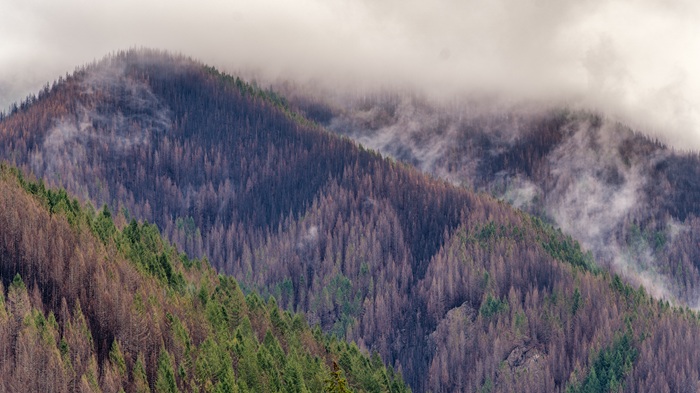
Making sense of forest and wildfire science through maps, visuals, and narrative.

Map showing crown fire probability across the U.S., illustrated using a map from VPDC’s ignition probability data story.
We use data stories to bring science into focus. Each story is grounded in transparent methods and reproducible data, helping readers see the patterns emerging across landscapes and apply these insights in ways that fit their own priorities and contexts.
Some stories introduce a single dataset, explaining what it measures, how it was built, and how it can inform real decisions. Others combine multiple datasets, models, and analyses to illuminate broader questions about risk, resilience, and the forces shaping today’s landscapes.
Each story follows the same purpose: to make science accessible, to show how data connects to lived experience, and to support communities, Tribal Nations, agencies, and practitioners working to steward healthier, more resilient ecosystems. Use these stories to learn, teach, and act: as companions to our datasets, as tools for community conversations, and as starting points for new questions and better decisions across forested landscapes.
more data stories
data stories in development
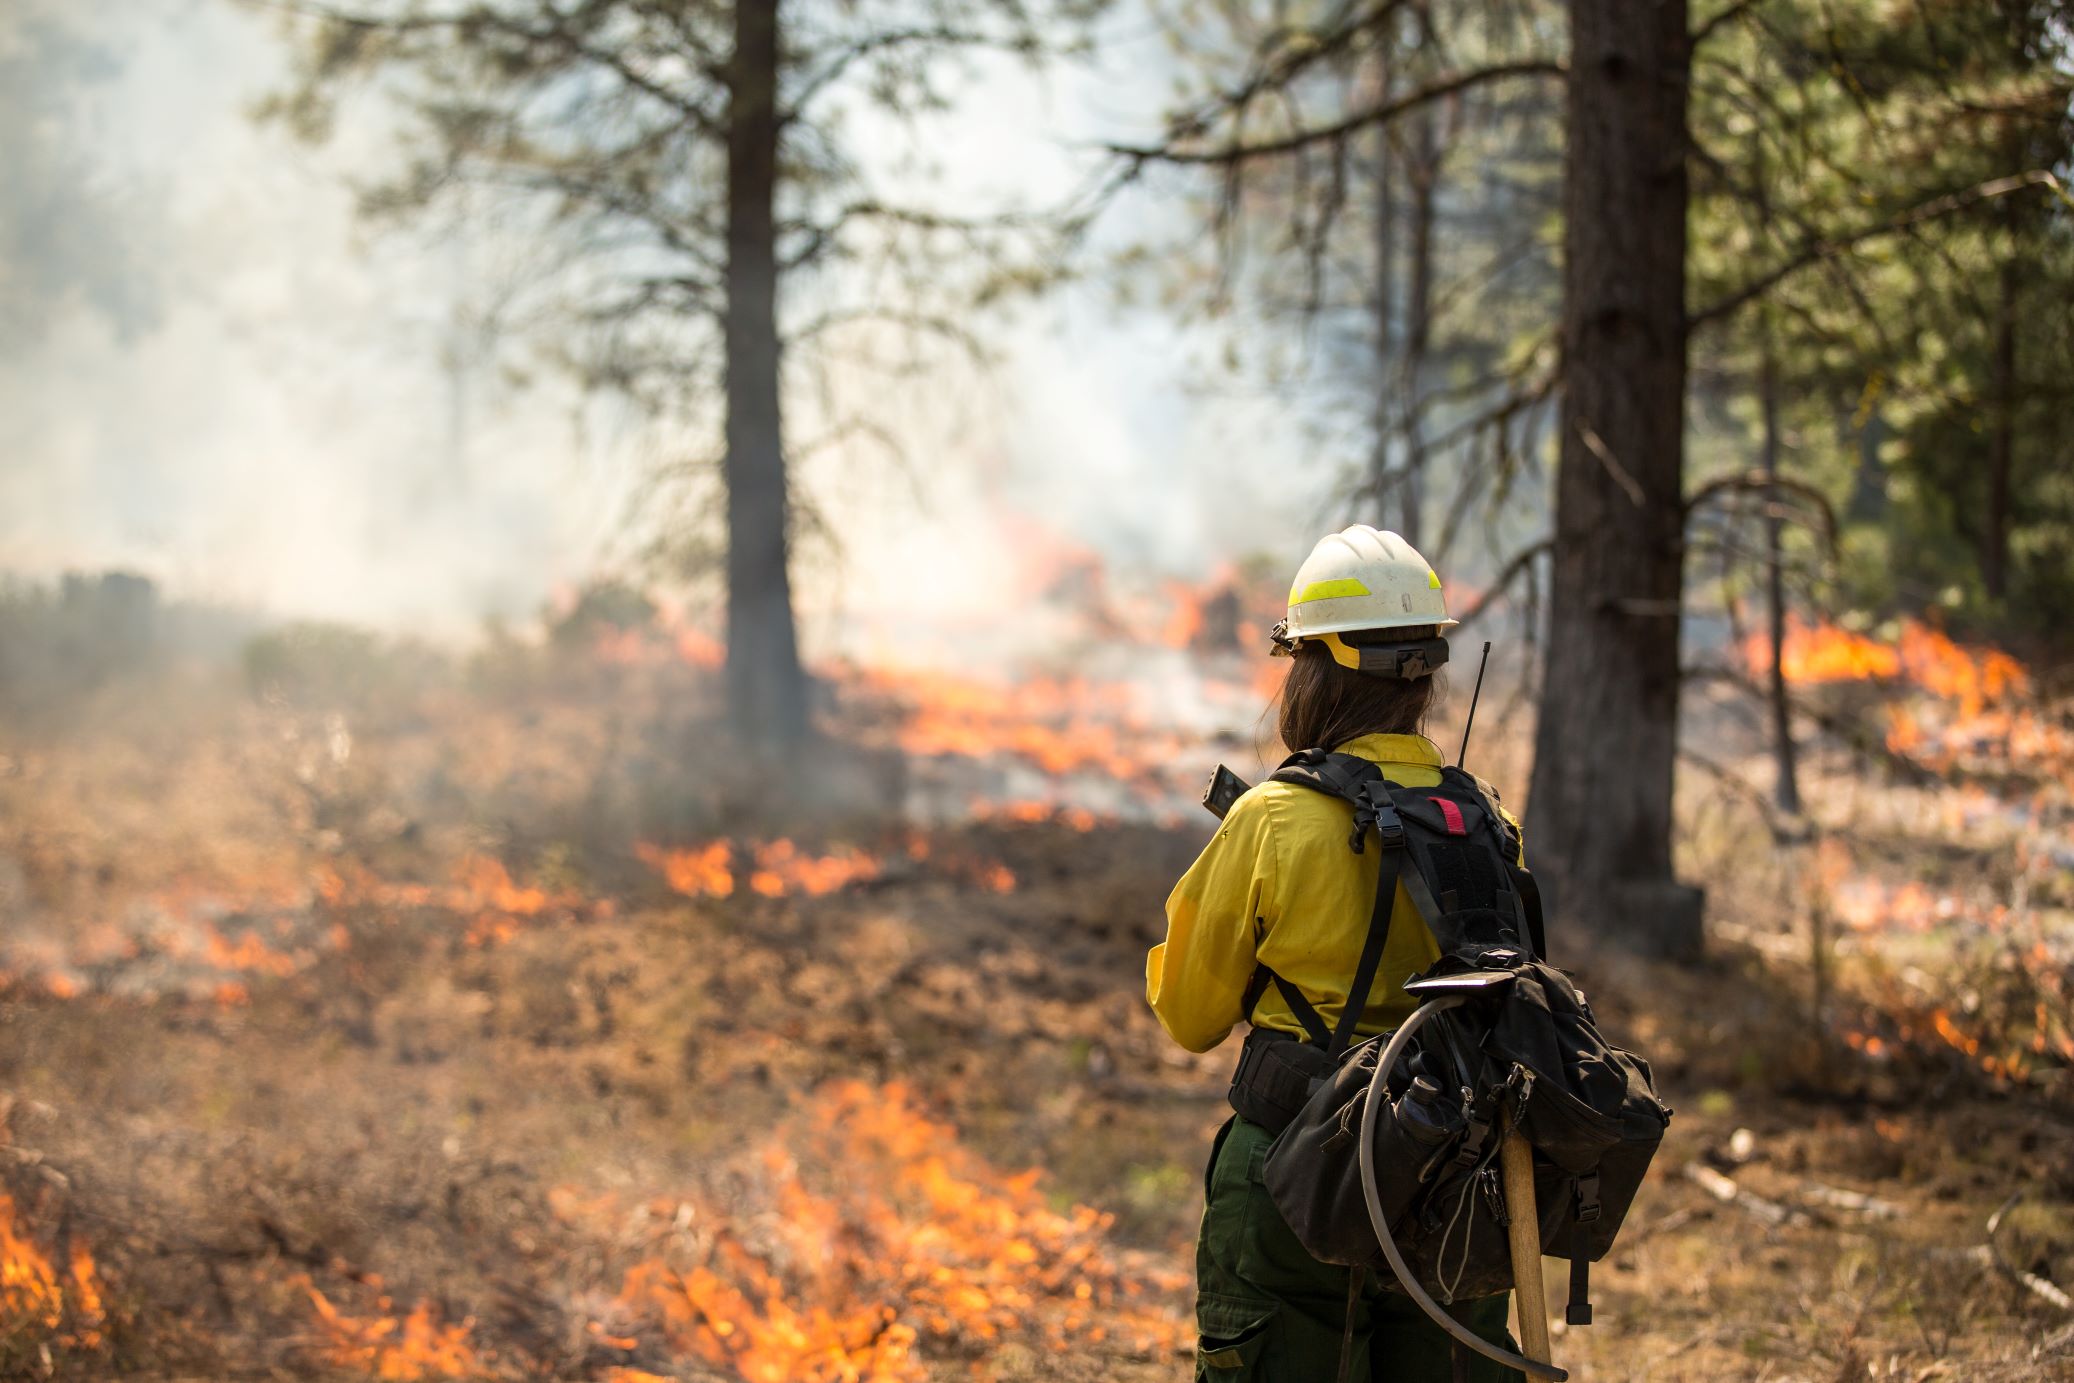
Expanding the Wildfire Resilience Conversation

We’re bringing three new wildfire datasets to our website, along with a data story exploring their significance and practical applications. In collaboration with Vibrant Planet and Dr. Mike Koontz, we’re making these datasets accessible to researchers, land managers, and decision-makers to strengthen wildfire analysis and planning.
The Historical Fire Perimeters dataset maps decades of wildfire boundaries, revealing fire frequency and spatial patterns. The Composite Burn Index (CBI) refines burn severity assessments using bias-corrected, validated methods (Parks et al., 2019b). The enhanced Percent Fire Regime Interval Departure (pFRID) measures shifts in fire frequency from historical norms, identifying areas where fire is occurring too often or too rarely.
By sharing these insights, we hope to support a deeper understanding of fire behavior, ecosystem responses, and strategies for wildfire mitigation and forest restoration. Stay tuned for the full data story on our website!
Mapping Debris Flow Risk in Fire-Affected Landscapes

Wildfire can drastically increase the risk of post-fire hazards, including debris flows that threaten communities, infrastructure, and ecosystems. This data story will explore debris flow probability at the catchment scale, incorporating fire modeling from Vibrant Planet's Pyrologix Team and their new burn severity prediction model. Our goal of sharing these datasets, is to provide risk planners, researchers, and other interested parties with a more precise understanding of where debris flows are most likely to occur following a wildfire. These insights support proactive planning, mitigation efforts, and emergency response strategies to reduce risk and enhance landscape resilience.
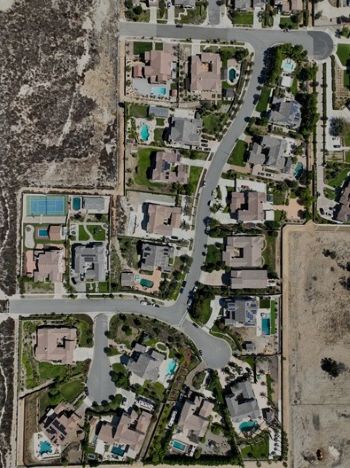
Generating Climate Smart Timber Products Data and Web App

In partnership with the Climate Smart Wood Group and Vibrant Planet, Vibrant Planet Data Commons is developing a simple, user-friendly web application that covers the contiguous U.S. to allow the Architecture, Engineering, and Construction (AEC) community to differentiate between wood products based on forest carbon and associated ecosystem impacts. The data shared will enable an improved understanding of the carbon benefits and burdens associated with varying approaches to timber production, along with an ability to effectively differentiate timber produced from different ownerships and regions of the USA. Forest carbon, disturbance classification, and timber output data will be shared in a timeseries for each landowner type in each county, going back in time as far as 1990 or 2000.