Wildfire Ignition Probability Data
Overview
Predicting the Cause of Wildfires
Wildfires are natural parts of many ecosystems, and they can present substantial challenges to land management and community safety. Understanding the likelihood of wildfire ignition is crucial for crafting strategies to navigate the unpredictable nature of wildfires. Developing spatial models of ignition likelihood becomes a key component in this effort, offering vital insights for risk-aware decision making in preparedness, prevention, fuels management, and response planning.
By distinguishing between spatial patterns of ignition, especially the significant impact of human activities, targeted prevention measures can more effectively mitigate risks to life and property. Amidst rapid climate change, the varied responses of human and natural ignition sources underscore the importance of refining these models for climate adaptation. Moreover, these models are indispensable for enhancing fire simulation tools and their subsequent use in detailed assessments of risk to communities and landscapes.

Photo by Diaconescu / Adobe Stock


Map by VPDC, 2024.
what is Wildfire Probability Ignition Data?
This data story explores the ignition probability datasets created in 2023 by Christopher J. Moran, Joe H. Scott, and Kevin Vogler, prominent wildfire scientists at the Pyrologix Wildfire Modeling Team, a division of Vibrant Planet. Their work focused on modeling wildfire ignition probabilities in the most wildfire-prone regions of the United States offers critical insights into managing these unpredictable and often devastating occurrences
Geography
The analysis focuses on two wildfire-prone regions in the United States: the Western states, known for their arid deserts and dense forests, and the humid, subtropical Southeastern states. These two regions, spanning 24 states, were chosen for their distinct fire regimes and environmental conditions. Understanding how wildfire ignition patterns vary from one region to the next aids managers in tailoring their strategies.

Map by VPDC, 2024.


Are you interested in applying ignition probability data to your research or management project?
We want to hear from you! Vibrant Planet and Vibrant Planet Data Commons are tracking the applied use of this wildfire ignition probability data so that we can demonstrate the impact of good data and research. Share your thoughts and help us improve our resources to better serve the land management, fire, and research communities.
why does this matter?
Understanding Ignition ProbabilityAnalysis
In wildfire management, ignition probability analyses are vital tools for predicting where fires are most likely to start. By considering factors like drought conditions, weather patterns, topography, human activities, and broad vegetation characteristics, these analyses help pinpoint high-risk areas.
What sets the work of Pyrologix's team apart from other research and modeling efforts is their modeling ignitions data is cause-specific, analyzing whether a fire has a natural or human-caused origin and highlights regional variations between the Western and Southeastern United States.
What sets the work of Pyrologix's team apart from other research and modeling efforts is their modeling ignitions data is cause-specific, analyzing whether a fire has a natural or human-caused origin and highlights regional variations between the Western and Southeastern United States.
Importantly, this model does not solely rely on historic fire locations. It predicts where high-potential ignitions could occur based on these diverse inputs, making it 'future-looking' while still capturing the spatial variations found in real-world fire patterns.

Lightning sparked the Lionshead Fire, captured here charring a manzanita tree. The fire started in the fall of 2020 and heavily impacted several surrounding communities. Wildfire ignition probability data helps predict areas susceptible to lightning strikes and other fire triggers. (Photo: Kevin Benedict / USFS)

Photo by Ed van duijn on Unsplash
How does it work?
Predictive Analysis for Wildfire Ignition Forecasting
In wildfire management, predictive analysis enhances conventional approaches by utilizing historical data and machine learning techniques to anticipate the timing and location of future wildfires. The core principle is that patterns observed in previous fire events can be leveraged to forecast future ignition sites. The availability of a comprehensive historical record of wildfires, including details of past occurrences and their contextual conditions, provides the foundation for constructing predictive models.
While a variety of sophisticated machine learning algorithms are available for predictive modeling in wildfire management, Pyrologix specifically utilized the Random Forest algorithm for its central role. This choice was driven by the algorithm's exceptional ability to handle complex datasets and was essential to integrate historical fire occurrence data with a wide range of environmental factors, including vegetation types, climate variables, and proximity to human development.
The algorithm works by combining the predictions of multiple decision trees (like a flowchart of questions), each trained on different portions of the data. This approach improves accuracy and prevents the model from focusing too heavily on any single factor. By incorporating insights from their refined ignition probability datasets along with other crucial data, Pyrologix's predictive models consider how these various elements interact to shape wildfire likelihood. The result is a set of probabilistic forecasts for human or natural causes of fire at 120m resolution that pinpoint high-risk areas across the U.S.
Applications
Why Use Predictive Analysis for Wildfire Management?
Predictive analysis in wildfire management is indispensable, particularly in an era where wildfires are becoming more frequent and severe due to climate change and other factors. Several key factors underscore its relevance and urgency:

Adapting to Climate Change and Increasing Fire Risks
Climate change is intensifying wildfire risks, making many regions around the world, including the United States, more susceptible to frequent and severe fires. Predictive analysis helps us understand these shifts, allowing for better preparedness and response.

Safeguarding Lives and Property
Wildfires pose significant threats to communities. Predictive modeling can guide emergency services in strategic planning and resource allocation, potentially saving lives and reducing property damage.

Conserving the Environment
Wildfires can have devastating ecological impacts. Predictive analysis aids in identifying critical areas for conservation, helping mitigate long-term environmental damage.

Optimizing Resource Allocation and Management
Strategic resource allocation is crucial for effective wildfire management. Predictive models inform land managers where to focus efforts like intentional burns, contributing to more efficient use of resources.

Photo by Alexandre Guimont on Unsplash

Building Adaptation and Resilience
Predictive analysis can enhance societal resilience against wildfires. It provides data for better preparedness and adaptive strategies in various sectors.

Informing Urban Planning and Development
Understanding wildfire risk probabilities is essential for safe development as urban expansion continues. This information is important for shaping building codes and land-use planning.

Guiding Insurance and Economic Decisions
The insurance sector relies on predictive wildfire analysis for risk assessment and premium settings. This analysis also helps in economic planning and recovery strategies.
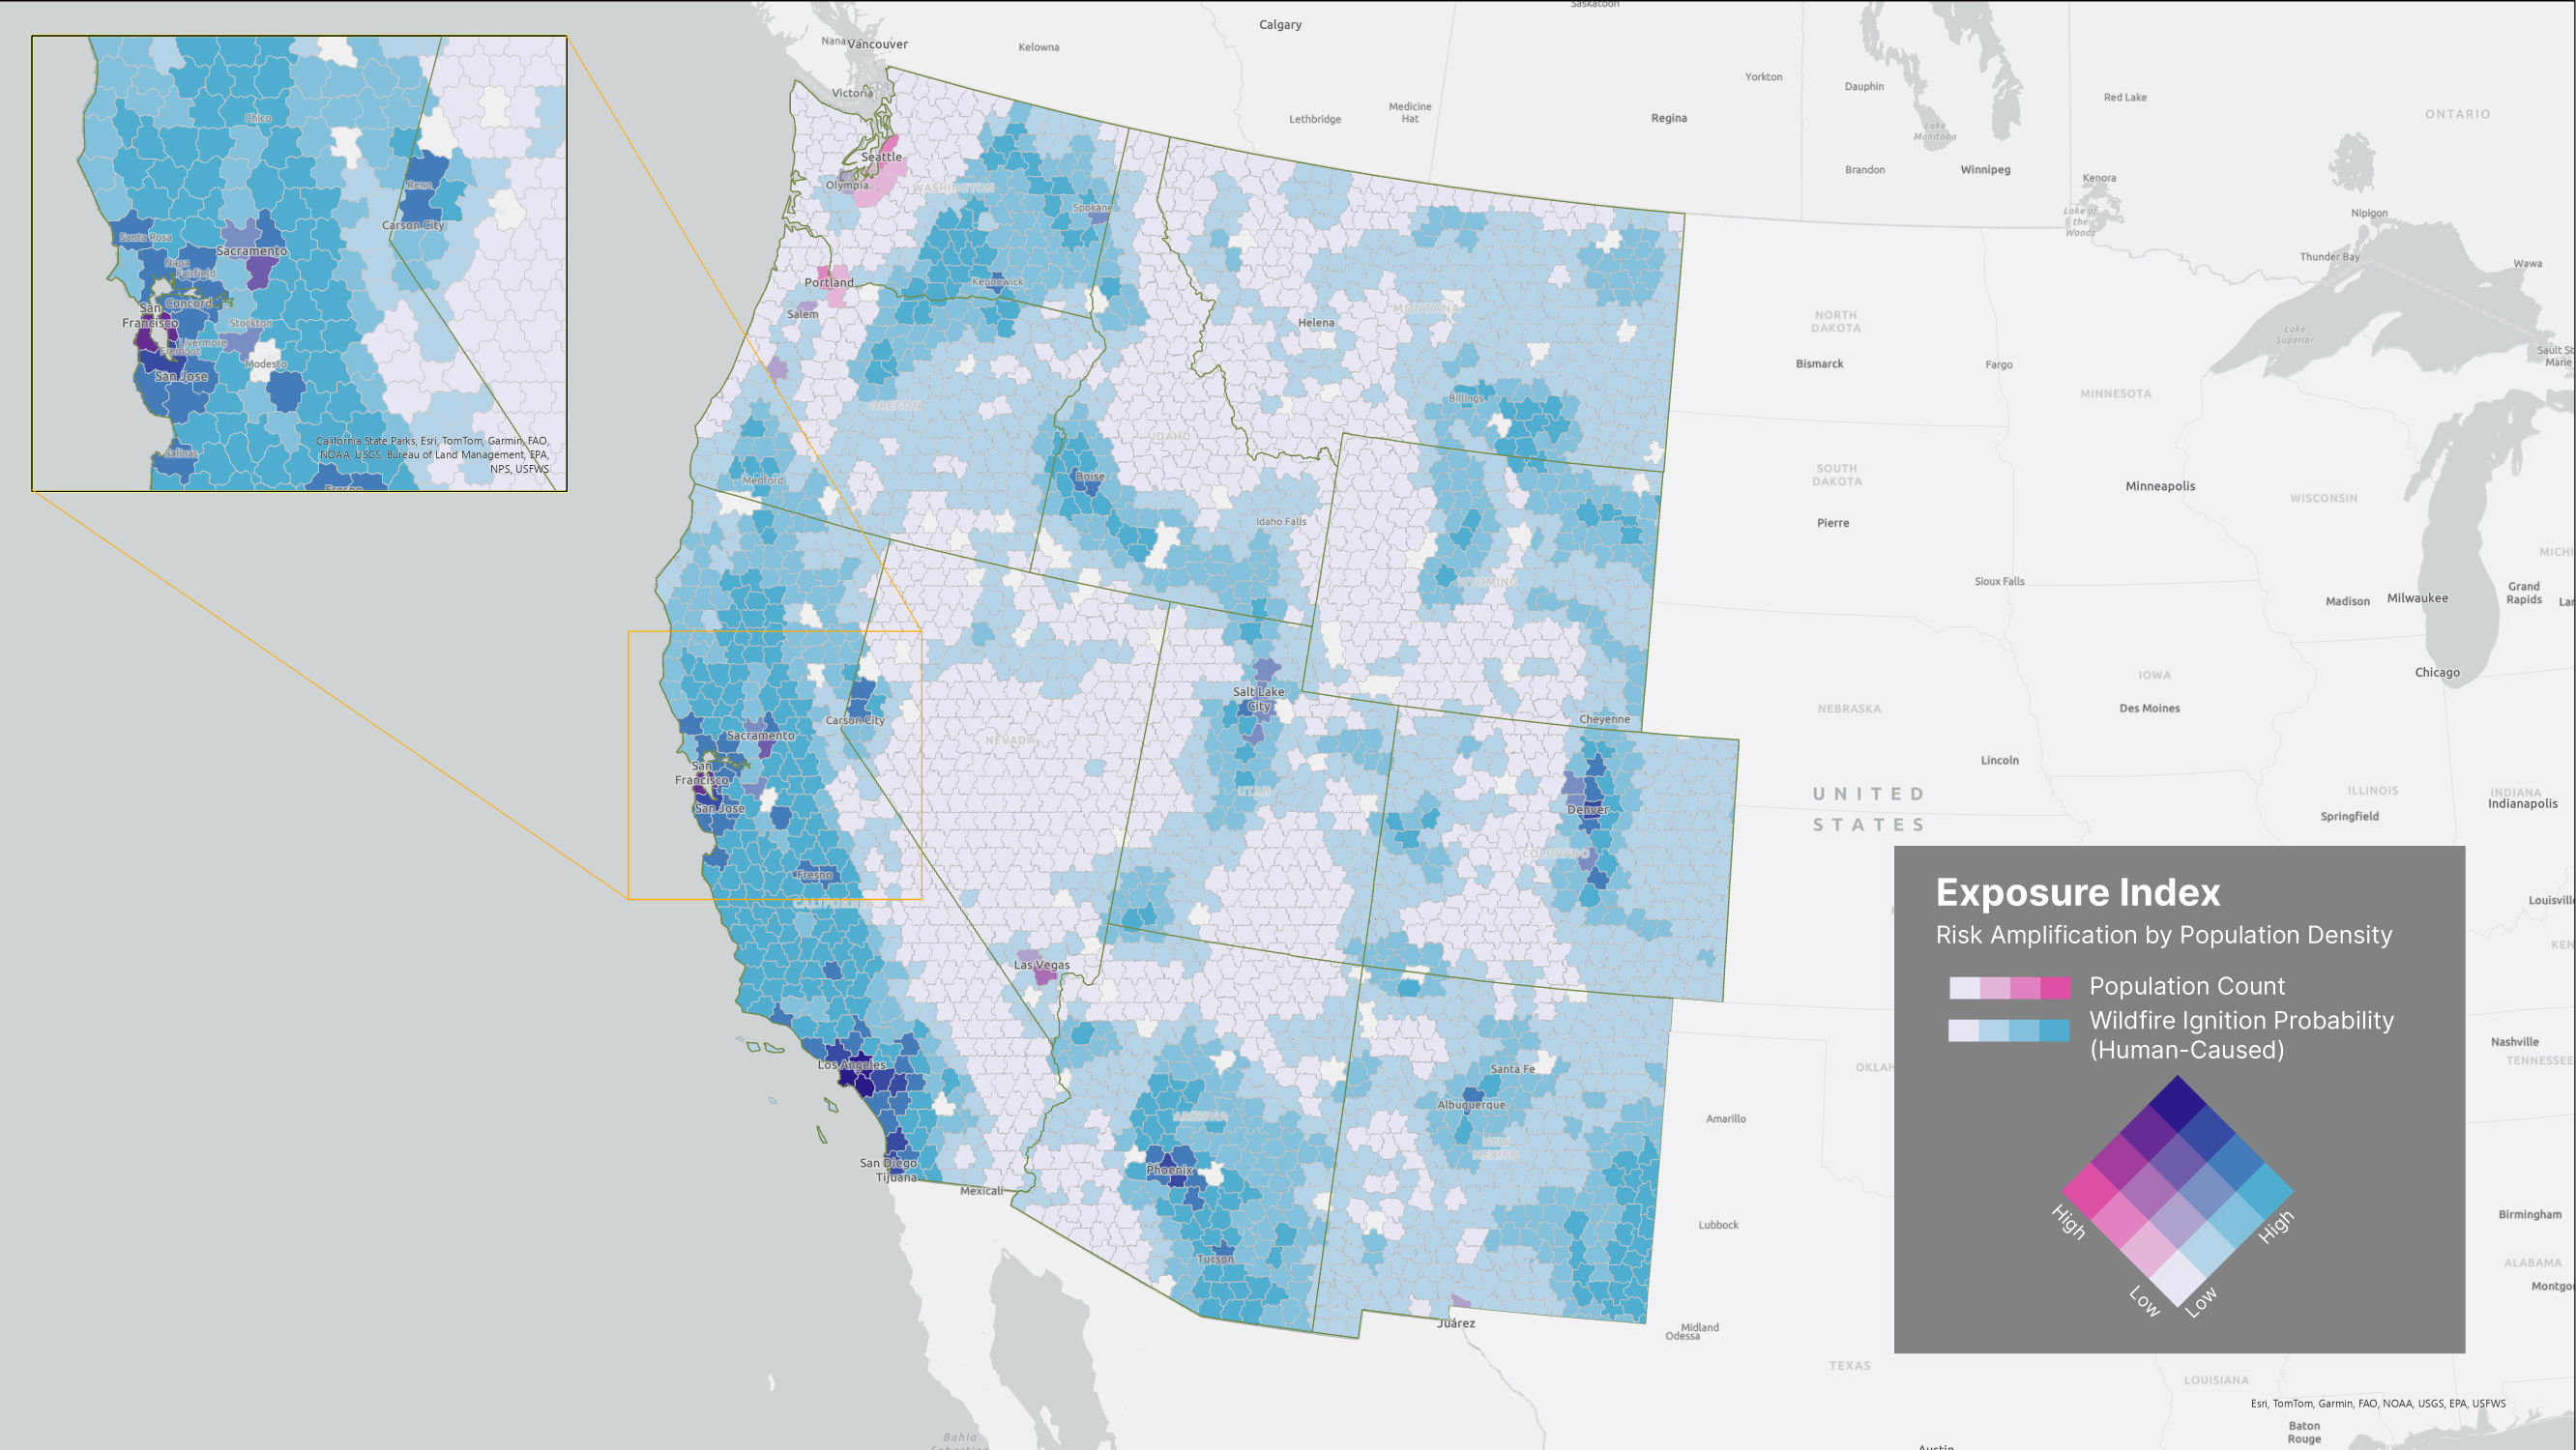


The human-ignition probability layer provides excellent information for planning fire prevention activities as part of a Community Wildfire Protection Plan, for example, and also to support fine-grained wildfire simulation modeling in the Wildland-Urban Interface. Having separate input layers for human and natural ignitions allows fire modelers to calibrate those two types of wildfire separately, allowing us to learn how those two origins contribute to hazard and risk across the landscape.
applied use case
Enhancing FSim Modeling and the Land Tender Tool with Wildfire Probability Ignition Data

Pyrologix, a Vibrant Planet company, has developed a valuable set of wildfire ignition probability data layers. The immediate application of this data is to enhance their Fire Simulation (FSim) models. FSim, a cornerstone in fire management and planning, simulates wildfire spread and behavior, providing vital information for effective wildfire risk management.
Application in FSim Modeling:
The integration of Pyrologix's ignition probabilities into FSim modeling marks a significant advancement. The updated Ignition Density Grid (IDG) input data transforms how fire simulations are conducted. This enhancement leads to more accurate placement of potential wildfire ignitions in the model, resulting in simulations that more realistically represent potential fire spread scenarios. For fire managers and decision-makers, this means an ability to predict and prepare for wildfires with unprecedented precision.
Impact on Vibrant Planet's Land Tender Tool:
This refined data also plays a pivotal role in improving Vibrant Planet's Land Tender tool. Land Tender, designed to optimize land management and restoration decisions, relies heavily on accurate fire behavior predictions. The enhanced FSim model, powered by Pyrologix's data described here, provides Land Tender with more reliable inputs. As a result, Land Tender can offer more precise recommendations for land treatments, resource allocations, and fire mitigation strategies, aligning more closely with the actual risks and behavior of potential wildfires.
Contribution to Quantitative Wildfire Risk Assessment (QWRA):
Pyrologix's team is a leader in providing quantitative wildfire risk assessments (QWRAs). Their improved ignition probability analysis builds upon their strong foundation of fire modeling innovation, which is essential for accurate QWRAs. This advancement provides a more detailed and 'future-looking' understanding of ignition likelihood, resulting in QWRAs with greater precision and long-term relevance for strategic fire planning. Additionally, modeling ignition likelihood by cause unlocks exciting new avenues in risk assessment. This allows for quantifying the potential impact of previously overlooked fire management strategies, such as targeted ignition prevention campaigns and infrastructure upgrades.

Photo by Nagara Oyodo on Unsplash
Charting the Future: Your Role in Shaping Wildfire Resilience
This ignition probability dataset presents a powerful tool for proactive wildfire management, offering researchers, data scientists, and land managers crucial data-driven insights.
- Access and Utilize the Data: Download the datasets and leverage their potential for research, modeling, and practical applications.
- Collaborate and Share: Foster data collaborations and knowledge sharing to further refine models, develop novel uses, and expand applicability.
- Advocate for Informed Policy: Champion data-driven wildfire prevention strategies grounded in accurate fire risk assessments informed by this data.
By harnessing the power of these ignition probability datasets, we can move beyond reactive firefighting and embrace a proactive approach to wildfire management, better protecting communities and ecosystems from the devastating impacts of these unpredictable yet predictable events.
Contribute to the wildfire data story!
Join our data community! Share your wildfire &/or forest-related data to improve collaboration, increase shared knowledge, and tell the most impactful stories.
Acknowledgements
This wildfire ignition probability data was made possible in part by funding from the Strategic Analytics Branch, Fire and Aviation Management, National Headquarters, United States Forest Service.